
在“Fat Margaret”的交互式媒体
如何使历史和科学数据变得易于理解、引人入胜,甚至更美丽呢?爱沙尼亚海事博物馆的永久展览于2019年11月29日在博物馆所在的中世纪大炮塔“Fat Margaret”中开幕,然而这些展品直到2020年1月才向博物馆的游客开放。Fat Margaret位于位于塔林的老城区,是一个受联合国教科文组织保护的世界文化遗产区域。经过精心修复的历史环境是叙述爱沙尼亚从中世纪到现代的航海历史的理想场所。建筑的每一层都邀请您回到航海史上的不同时代,重点关注造船、贸易以及不同时期船员的生活,无论是帆船时代、蒸汽船时代还是汽船时代。
AIS的实时可视化
为展览开发、设计和构建的30多个不同的数码解决方案各具特色——其中一些展品使用大规模实时数据,一些体验更注重实践和感官体验,而一些则基于广泛的研究。然而,所有展品都共有一个共同目标:通过基于真实数据、科学研究和优秀设计的可关联、引人入胜的体验,让更广泛的博物馆游客打开迄今为止陌生的海上贸易和航海方面的视野。
重建700年前的大木船
展览以收藏的亮点开始——一艘700年历史的大木船残骸,于2015年在塔林发现。这次发现非常罕见——这艘中世纪的贸易船保存完好,船上的发现物丰富多样。伴随这些发现的数码解决方案帮助讲述了从发现、挖掘和运输大木船到准备展览、清洁和保护工作的整个故事。通过三维建模,可以全方位展示大木船的残骸,并在触摸屏上显示所有细节,甚至在巨大的LED屏幕上创造出船在海上航行的沉浸式动画。目标是让游客有一种真实感,就好像一艘完整比例的大木船从你身旁经过一样。此外,这个三维模型还被用来进行三维打印,用于实物模型,以更好地帮助有特殊需求的博物馆游客。
视觉化丹麦国家档案馆保留的声音通行费登记册——这是一个真正的历史大数据案例。这些登记册是15世纪至19世纪捷克王对通过丹麦海峡(瑞典和丹麦之间的海峡)的船只征收的通行费账目。为了展示这个展品,数百万个数据点被分析,以确定哪些船只、船长和货物与爱沙尼亚的哪些港口有关联。展览中的数千个点在地图上移动,代表着港口之间的货物流动:您可以体验到海上贸易的流动,并思考为什么1853年竟然从希乌马岛运送了220万只松鼠皮到伦敦。这个解决方案将地图与投影相结合,展示了汉萨同盟最大的城市之间的货物流动情况,货物的性质也可能会令人惊讶。
称重货物展品
一种受到家庭喜爱、引发人们对船运货物价值的讨论的展品被称为“称重货物”。参观者可以一个一个地或组团踩上秤,屏幕上会显示出如果你的身体重量全部都是黑胡椒,那么它相当于多少鲱鱼或松鼠皮的价值(在1500年时)。由于每个参观者的体重都不同,所有的计算和可视化都是实时进行的。
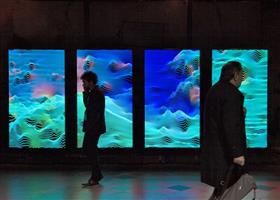
参观者的运动产生波浪和尾涡图案
有些展品更注重事实,有些则更注重创造出完整的环境体验:仍然通过感官体验来解释海洋的各个方面。在博物馆的地板上,两个高度6米的大屏幕会根据路人的经过作出相应的反应,仿佛真实的海洋一样。参观者的运动会产生波浪和尾涡图案。当参观者彼此靠近时,会出现小暴风雨。此数码波浪展品采用简化的天气预报算法。
用于在触摸屏上开发数码展品的数据库提供了不同时期海上交通和海运网络的概览。该地区的海洋贸易历史可以追溯到中世纪,当时爱沙尼亚城市是汉萨同盟的一部分-这个展览通过展览设计,为所有的航海时代提供了可观、易于理解和富有趣味性的大量数据。
Interactive media for Fat Margaret
How to make historical, scientific data understandable, engaging, and even more: beautiful? Estonian Maritime Museum’s permanent exhibition was opened in the museum’s home, medieval cannon tower Fat Margaret, in November 29th 2019, however the exhibits presented here were finalized in January 2020 and only then made accessible to the museum visitors. The Fat Margaret is located in Tallinn’s Old Town, a UNESCO Heritage protected area. This delicately renovated historic environment is a perfect location to tell Estonia’s sea-going history from the middle ages to the modern times. Each floor of the building invites you to travel back to a different era in maritime history, with a focus on shipbuilding, trade and the life of seafarers in different times, be it the era of sailboats, steamboats or motorships.
Real-time visualisation of AIS
All of the more than 30 digital solutions developed, designed and built for the exhibition are different in character – some exhibits use big real-time data, some experiences are more hands-on and sensory and some are based on vast research. However all exhibits share a common goal: to open up thus far unfamiliar aspects of sea trade and sea faring to the widest range of museum visitors by creating relatable, engaging experiences based on real data, scientific research and excellent design.
Reconstruction of 700 year old cog
The exhibition begins with the highlight of the collection – a large 700 year old cog wreck, discovered in 2015 in Tallinn. The find is extremely rare – this medieval trading vessel is well preserved and the findings from aboard the vessel rich and diverse. Digital solutions accompanying the findings help to tell the whole story from the discovery, excavation and transporting the cog to preparing it for the exhibition, the cleaning and preservation works. Modelling the cog in 3D helps to show the wreck in its entirety and all the details on touch screens and even to create an immersive animation of the vessel sailing the sea on huge LED screens. The goal was to create a feeling for the visitors of what it would feel like if a full scale cog would pass you by, close up. In addition, the 3D model has been used to 3D print both the cog wreck and the reconstruction in scale for a hands-on model to better assist museum visitors with special needs.
The visualisation of the Sound Toll Registers kept by Danish National Archives – a real case of historical bigdata, visualised. The Registers are accounts from the 15th to 19th century of the toll which the king of Denmark levied on the ships going through the Sound, the strait between Sweden and Denmark. For this exhibit, millions of datapoints were analysed to find out which ships, captains and goods could be associated with which Estonian ports. Results were visualised in an exhibit where thousands of points moving on a map represented the goods moving between ports: you get to experience the flow of sea trade, and consider why 2.2 million squirrel skins might have been shipped from Hiiumaa island to London in 1853. The solution mixing a map and a projection shows the movement of goods between the biggest Hanseatic cities and also the nature of the goods which today can be rather surprising.
Weighed goods exhibit
A family-favourite exhibit that provokes discussion into the worth of ship-transported goods is called Weighed Goods. One by one or in a group, visitors are invited to step on scales and see on the screen that if your body mass was all black pepper, how much cured herring or squirrel skins would that be worth (in year 1500). As each visitor is of a different weight, all the calculations and visualisations are made real-time.
Visitors’ movements create waves and wake patterns
Some exhibits are more factual, some are more about creating a complete environmental experience: still explaining aspects of the sea, but through a sensory experience. On the floor of the museum, two 6-metre tall screens respond to passers-by as the real actual sea would. Visitors’ movements create waves and wake patterns. Mini-storms occur when visitors pass each other at a close distance. The digital waves exhibit uses a simplified weather forecasting algorithm.
The databases used to develop digital exhibits on touch screens give an overview of sea traffic and maritime networks in different eras. The history of sea trade in the region dates back to the middle ages when the Estonian cities were part of the Hanseatic League – this exhibition takes otherwise unmanageable data available from across all the sea-faring eras, and makes it accessible, relatable and playful through exhibition design.